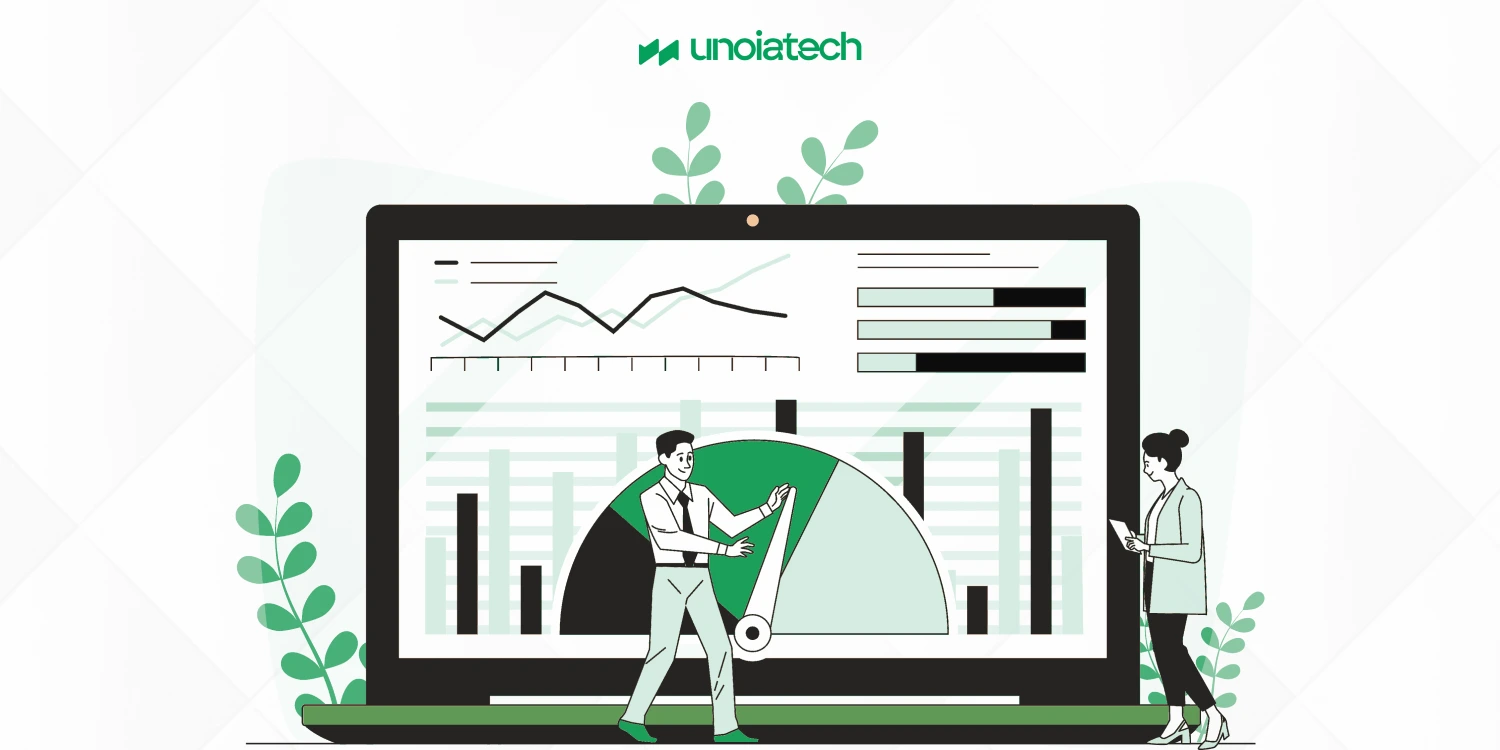
Data visualization dashboards are essential tools that convert complex datasets into intuitive visual formats, enabling swift and informed decision-making. By presenting data through graphs, charts, and interactive elements, these dashboards allow stakeholders to quickly grasp intricate information, identify trends, and uncover actionable insights. This visual approach enhances comprehension and facilitates a more nuanced understanding of business patterns that might remain hidden in traditional reports.
Accelerating the Decision-Making Process
Implementing data visualization dashboards streamlines decision-making by providing real-time access to critical metrics. Decision-makers can promptly identify trends, outliers, and patterns without sifting through extensive raw data. This efficiency is crucial in time-sensitive situations where strategic decisions depend on the immediate interpretation of data narratives.

Metrics and Key Performance Indicators at the Forefront
Dashboards serve as centralized platforms for monitoring essential metrics and Key Performance Indicators (KPIs). By dynamically presenting data, they offer instant insights into performance relative to predefined objectives. This clarity enables organizations to assess operational health, guide strategic adjustments, and focus investments effectively. For instance, a marketing team can utilize a dashboard to track campaign performance metrics, such as conversion rates and customer acquisition costs, facilitating data-driven decisions to optimize marketing strategies.

Exploring Different Types of Data Visualization Dashboards
Selecting the appropriate type of dashboard is vital to align with specific business objectives. The main types include:
- Operational Dashboards: These provide real-time monitoring of daily processes and activities, enabling management to track performance continuously. For example, a call center dashboard displaying current call volumes and response times assists in managing customer service efficiency.
- Analytical Dashboards: Designed for in-depth analysis, these dashboards process historical data to identify trends and support forecasting. They are typically used by data analysts to derive insights from large datasets over time. A marketing team might use an analytical dashboard to evaluate campaign performance over the past quarter, identifying successful strategies and areas for improvement.
- Strategic (Executive) Dashboards: These offer a high-level overview of an organization’s health and trajectory, summarizing KPIs and critical metrics to inform long-term decisions. Executives can use strategic dashboards to monitor overall business performance, such as revenue growth and market share, without being overwhelmed by detailed data.
Enhancing Engagement with Dashboard Interactivity Features
Incorporating interactive elements into dashboards enhances user engagement and facilitates deeper data exploration:
- Dynamic Filters and Drill-Down Capabilities: Allow users to customize data views by applying filters or drilling down into specific data points for more detailed information. This interactivity transforms dashboards from static displays into exploratory tools, enabling users to uncover insights tailored to their needs.
- Interactive Charts and Toggle Switches: Features such as adjustable charts and toggle switches enable users to manipulate data presentations, enhancing the user experience and making complex datasets more accessible. For instance, toggling between different data views can help users compare performance metrics across various time periods or departments.
Security and Privacy Considerations in Data Visualization Dashboards
Ensuring the security and privacy of data within dashboards is paramount:
- Data Encryption and Authentication Protocols: Implementing encryption and robust authentication measures protects against unauthorized access and data breaches .Role-based access control ensures that users can only view or manipulate data according to their permissions, maintaining data integrity and confidentiality.
- Privacy Controls and Compliance: Incorporating data anonymization techniques and adhering to data governance policies help maintain privacy standards and comply with regulations such as GDPR or CCPA. Clear data retention and deletion policies further ensure that sensitive information is managed appropriately throughout its lifecycle.
Enhancing Team Proficiency in Data Visualization Dashboards
Maximizing the effectiveness of data visualization dashboards requires equipping teams with the necessary skills:
- Training Programs and User Adoption Strategies: Providing comprehensive training and support helps overcome adoption challenges, ensuring that team members can effectively utilize dashboards to derive insights and make informed decisions. Hands-on experience, clear documentation, and ongoing assistance are crucial components of successful user adoption.
Mastering Dashboards for Superior Insights and Performance
Proficiency in using data visualization dashboards empowers organizations to harness the full potential of their data:
- Enhanced Decision-Making and Productivity: By simplifying complex data and revealing patterns, dashboards facilitate quicker and more effective decision-making. Immediate access to visualized data enables teams to act promptly, enhancing overall productivity. For example, a sales team can monitor real-time performance metrics to adjust strategies and meet targets more efficiently.
- Risk Management and Predictive Analysis: Dashboards assist in identifying potential risks and opportunities through predictive analysis, enabling proactive management and strategic planning. Visualizing data trends can help organizations anticipate market shifts and adjust their operations accordingly.
In conclusion, data visualization dashboards are indispensable tools in the modern data ecosystem. They transform raw data into actionable insights, enhance decision-making, and improve operational efficiency. By selecting the appropriate dashboard type, incorporating interactive features, ensuring security and privacy, and investing in team proficiency, organizations can fully leverage these tools to drive success in today’s data-driven landscape.
Get Started with Unoiatech
Transform your data into actionable insights with Unoiatech’s data visualization dashboard services. Contact us today to discuss how we can assist you in leveraging your data for enhanced business performance.


